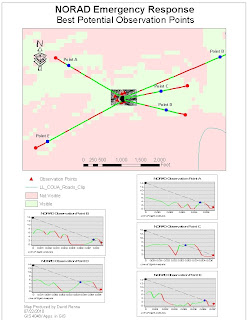
This is week 10 deliverable 3. This was by far the hardest map for me to produce. I had to reproject the necessary data so that the calculations would come out correctly. I probably spent have of the time this week on this map alone. That being said. I believe this would be a good tool in homeland security of critical sites like NORAD.
The map shows 5 observation point which I established along the hillsides surrounding the NORAD tunnel. These 5 sites would be vital in an emergency. We then used the line of sight tool in the 3-d Analyst toolbar to establish areas outside of the image where visual observation would not be possible due to hills and valleys. The tool allows us to interpolate where good sites are for additional observation through camera surveillance. The red in the lines show areas a;ong the line where visibility is obscurred. The blue dots show exactly where 5 new camera surveillance post should be set up to optimize the surveillance of the area in case of an emergency. In addition, the graphs of each of the line of site analysis are included to better understand the position along the line where the new surveillance camera network is to be set up. The graphs illustrate the elevation of the surrounding lands along the line of site and show how visibility would be obstructed. They also give us a good idea as to what areas the new sites will be observing such as hills and valleys.

No comments:
Post a Comment