Wednesday, June 30, 2010
Week 7: St. John's County Home Site Selection
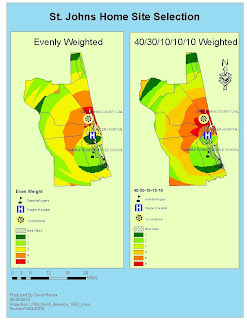
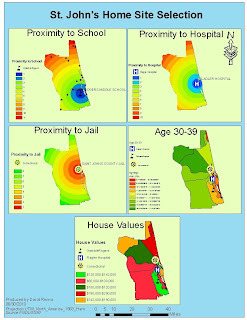
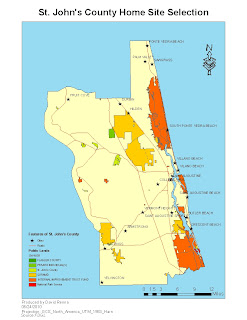
This is my week 7 Deliverable for Home Site Selection in St. John's County, Fl. I had a few problems with licensing on the server 2. I know I'm not the only one. After many hours of checking my Environments and looking through the ESRI website for answers I was able to perform all calculations just like Week 6. The size of the map only became a problem when I had an extra page in my pdf. I thought this was the least of the problems. Had problems linking pdf file to blog.
Thursday, June 17, 2010
Week6: Map Overlays
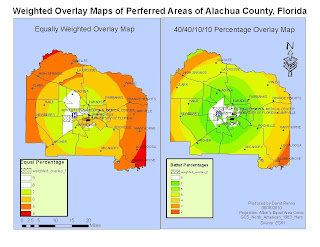
This is Deliverable3 for week 6. The map consist of 2 maps. The one one the left show a equal distribution of the 4 parameters. The second shows a more accurate depiction 40/40/10/10 percentage of what the couple thinks is important in buying a house. I have chosen the same color ramp for this project Green - Red to emphasize the green areas as good. I also adjusted to most desirable areas to clear to highlight them. This gave me a good idea on both maps as to desirable areas and the tract data so I could pick 3 areas in each to have as the top 3 areas.The one area on both is just SW of the hospital and is where I beleive the couple should search.
Week6: 4 Maps Approach to Decision Making
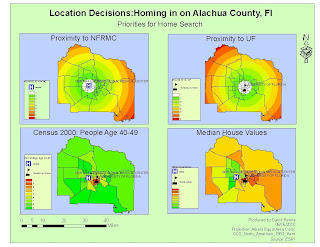
This is Deliverable 2 for week 6 in Applications in GIS. This map is composed of 4 different maps. Each map is associated with a known parameter for the couples decision making process.
The first is proximity to North Florida Regional Medical Center. I used the same color ramp for all my maps. Green to Red. Green being good. I altered the closest proximity for easier visual impact.
The second map is of the proximity to UF. I used the same techniques to highlight the closest region.
The third map is of the percentage of people in each area 40-49 years of age. The couple wanted this to be their third evaluating parameter as they want to be around people their own age.
The fouth map is of mean home values as the couple want to be in a good area with high mean home values.
Week 6 Basemap of Alachua County Florida
Monday, June 14, 2010
Week 5 : Urban Planning and Impact Assessment
Week 5 : Urban Planning and Impact Assessment
Week 5 : Urban Planning and Impact Assessment
Sunday, June 13, 2010
Participation 2-4: GIS Role in Oil Spill
GIS plays a vital role in disaster response. It can be used to assist in the efforts of first responders, Environmental and Federal Agencies, National Wildlife and Fishing Agencies, and in the efforts of local business to be prepared for natural disasters.
With respect to the Deepwater Horizon Oil Spill, GIS has been used by first responders to track the extent of the oil and its movement. GIS has played a key role in the efforts of first responders. It has done a great job in showing areas of concern for people on ground zero. Maps have been made to show the flow of the oil with respect to landfall.
Environmental and Federal Agencies have used GIS to produce ESI index maps of the various species and conservation areas that are going to be effected by the oil spill. National Fishing Agencies have used GIS to map out the oil spill in order to close boundaries for fishing both in offshore and inland waters.
Finally, local governments and businesses are using GIS to access the economic impact that this catastrophe is having on the region. GIS might not be the cure for a natural disaster like the Deepwater Horizon Oil Spill, but it sure has played a vital role in the initial efforts in the area to make decisions based on the latest data available.
Wednesday, June 9, 2010
Horizon Oilspill: Booming Operations
Horizon Oilspill: ESI Species Areas of Concern
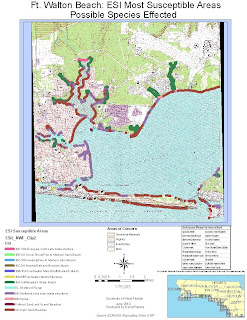
On my second map, I have detailed the areas where susceptible habitat and species are located. I used the guidelines for Alabama from the readings to use appropriate horizontal hatched colors to represent each types of species and the areas where they are known to survive or have been spotted in the last year as per Alabama guidelines. I found that I could not represent each species as a symbol. So this is how I did it. I also included a chart with identifyable species of each type on the map.I also included my Socecon point data to show that there are 26 points. 21 marinas, 4 beaches, and 1 airport.
Horizon Oilspill: ESI Areas of Concern/Management Areas
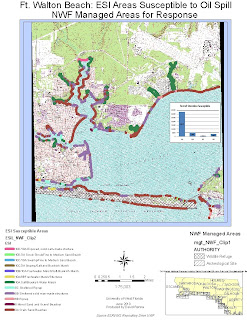
I chose the area around Fort Walton Beach. It is actually tile 17 in the South shoreline and bay area of Oskaloosa County, FL.This is the first of 3 maps. I have highlighted the ESI Areas of greatest susceptibility to oil. I tried to use appropriate colors for the areas. I also have included Management Areas for easier access to Fedeeral and State help.
Monday, June 7, 2010
Fishery Areas Closed Due to Oil Present: 05/25/10
Wednesday, June 2, 2010
Hurricane Katrina:Types of Lands Affected by Storm Surge
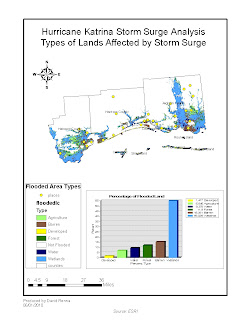
I have included the approximate areas which flooded during Hurricane Katrina. I have indicated the land types that flooded includ Agricultural,Barren,Developed,Forest,Not
Flooded,Water, and Wetlands. The chart also shows a visual representation of the types of lands which flooded and the associated percentages.
Hurricane Katrina: Map of Important Features
Subscribe to:
Comments (Atom)


