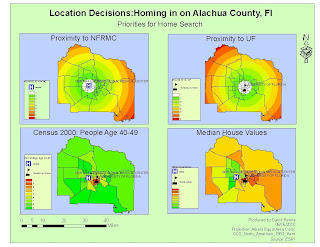
This is Deliverable 2 for week 6 in Applications in GIS. This map is composed of 4 different maps. Each map is associated with a known parameter for the couples decision making process.
The first is proximity to North Florida Regional Medical Center. I used the same color ramp for all my maps. Green to Red. Green being good. I altered the closest proximity for easier visual impact.
The second map is of the proximity to UF. I used the same techniques to highlight the closest region.
The third map is of the percentage of people in each area 40-49 years of age. The couple wanted this to be their third evaluating parameter as they want to be around people their own age.
The fouth map is of mean home values as the couple want to be in a good area with high mean home values.

No comments:
Post a Comment