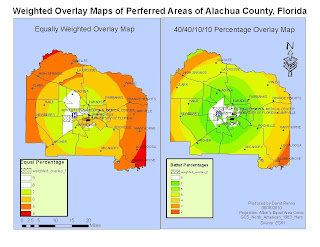
This is Deliverable3 for week 6. The map consist of 2 maps. The one one the left show a equal distribution of the 4 parameters. The second shows a more accurate depiction 40/40/10/10 percentage of what the couple thinks is important in buying a house. I have chosen the same color ramp for this project Green - Red to emphasize the green areas as good. I also adjusted to most desirable areas to clear to highlight them. This gave me a good idea on both maps as to desirable areas and the tract data so I could pick 3 areas in each to have as the top 3 areas.The one area on both is just SW of the hospital and is where I beleive the couple should search.

No comments:
Post a Comment